
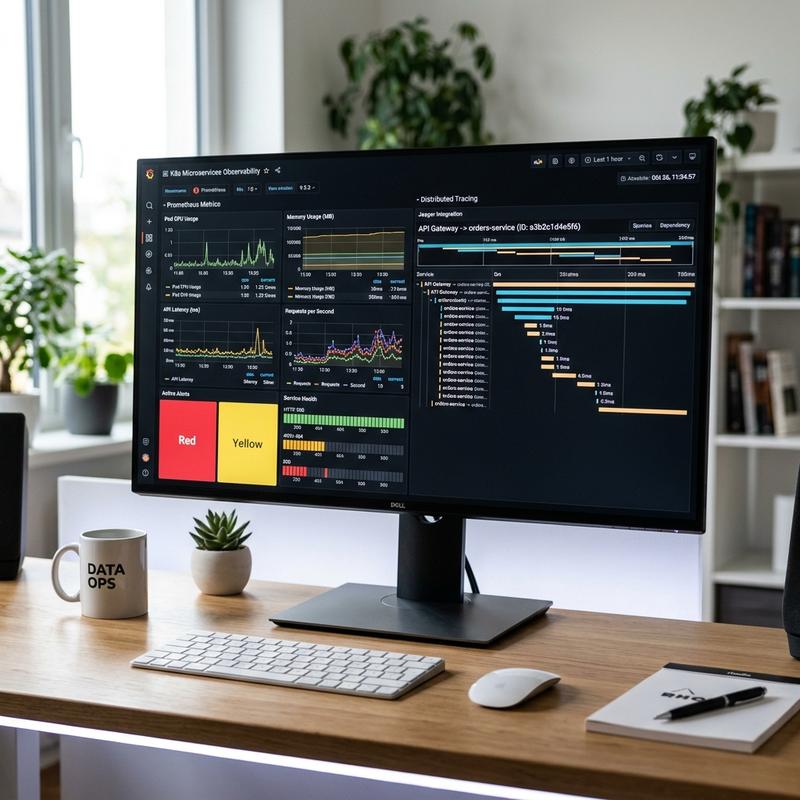
The Three Pillars of Observability
To debug complex distributed microservices, engineers need visibility into system state. Consolidating metrics, logs, and distributed traces allows teams to jump from a failing metric directly to the offending logs and traces.
Setting Up the Stack
• Prometheus for Metrics: Collect numerical time-series metrics from microservice endpoints using scraper agents.
• Grafana Loki for Logs: A metadata-driven logging system that correlates log streams directly with Prometheus labels.
• Tempo for Distributed Tracing: Trace request lifecycles across gRPC and HTTP boundaries using unique correlation IDs.
Correlating Telemetry
1. Exemplars: Inject trace IDs directly into Prometheus metrics so engineers can click a spike on a graph and immediately inspect the matching trace.
2. Structured Log Injection: Inject transaction and span IDs into all application log outputs automatically.
3. Unified Grafana Dashboards: Create dashboards that tie metric graphs, Loki log panels, and Tempo trace timelines together.